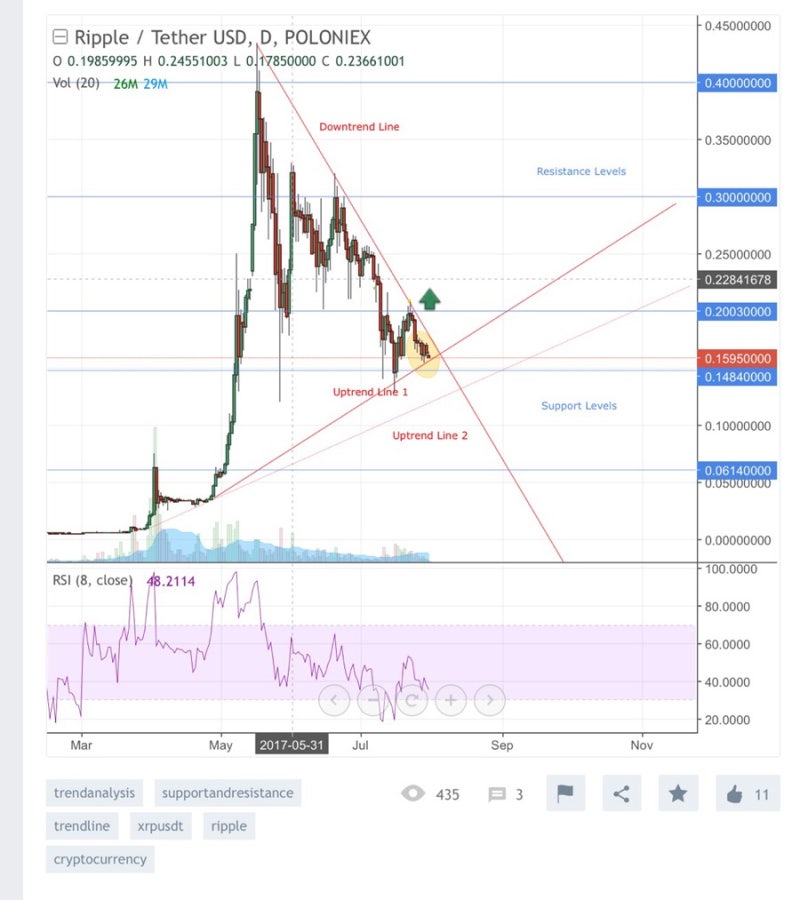
On the daily chart we can see that price is in a very important zone now. From the bottom the market is supported by the uptrend line 1 and the support level .
The downtrend line is a barrier for possible upward movement. We have to watch for price action in this zone more closely.
Because the direction of a breakout will show us further price movement. If the market breaks the uptrend line
1, we’ll see downward movement to the uptrend line
2. This support line also will be able to stop and reverse the falling market. If we get a confirmed reversal signal from the uptrend line
2, we’ll be able to think about buying from these levels. If the market bounces from the uptrend line 1 and then breaks the downtrend line,
we’ll get confirmation for further upward movement and a buy signal. Stop orders for all long trades
must be placed below the local 1.79% swing lows. Profit targets should be the resistance levels.
바이낸스 거래소 수수료 20% 할인 가입 바로가기
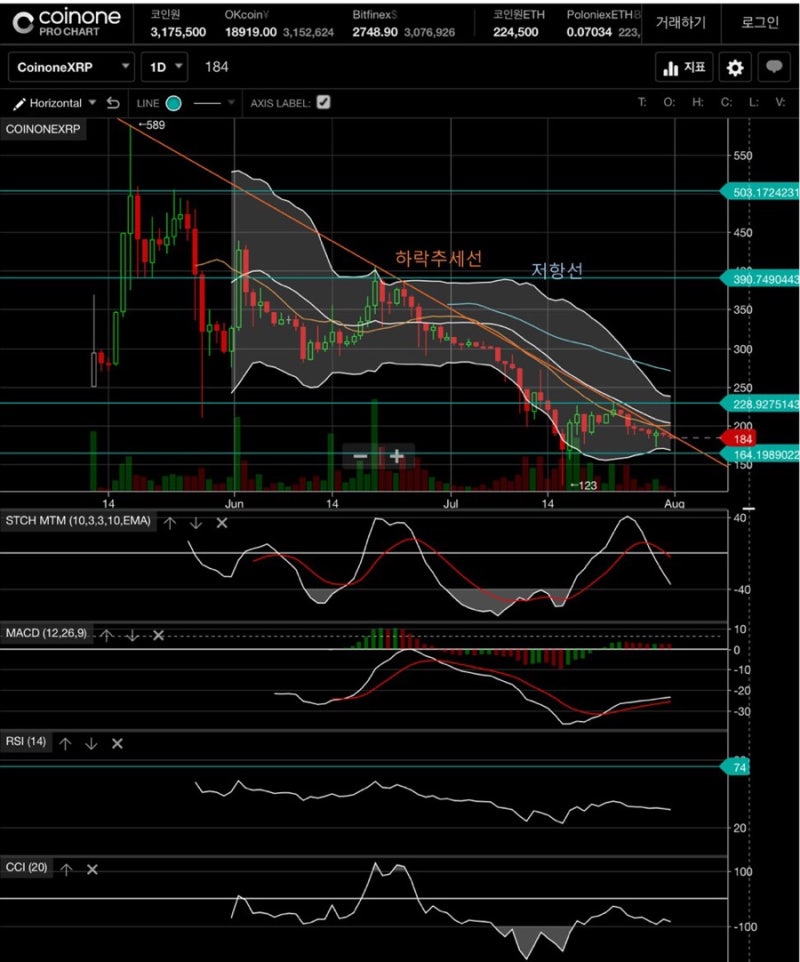
한국차트는 리플이 5월부터 상장해서 지지선을 그릴수 없으므로 기존 폴로차트를 참고해야합니다.
가격은 상향추세선과 지지레벨(184원대)에서 지지하고있음
하향추세선을 돌파시 매수시그널(시간에 따라 달라지지만 190원 +-1)
상향추세선라인1이 깨지면(180원초반대) 2번라인(100미만)까지 하락가능
매수시그널로 매수시 수익구간은 저항선(228원, 300원, 390원)을 목표로 매도
바이낸스 거래소 수수료 20% 할인 가입 바로가기
시그널만 보지마시고 지표,거래량, 비트 상황도 참고하여 현명한 거래 하시길 바랍니다
리플의경우 내일 sbi은행 호재가 있다는 썰을 저번에 언급하였는데 어찌될지 궁금하네요

